
heartbeatRadar

← Instagram

Original öffnen ↗
@danielpriestleyDaniel Priestley·US·305k Follower

How I went from raw data to a detailed marketing plan in 1 train ride...

Reel·55s·veröffentlicht 31.08.26 (vor 1 Monat)·erfasst 09.09.26
0,5×Faktor (Views / Median 3.503, n=26)
1.879Views
24Likes
0Kommentare
Talking HeadSystem BreakdownHook: story einstieg45-90sProduktion: mittelUntertitel: einwort karaokeCTA: kommentar keywordKonfidenz hoch

Warum es so läuft

Der Post liegt mit Faktor 0.56x deutlich unter dem Median dieses Accounts, ist also ein unterdurchschnittlicher Post. Trotz klarem System-Breakdown-Inhalt, Karaoke-Untertiteln und einem konkreten Story-Hook erreicht er nur 1.879 Views bei 24 Likes und null Kommentaren. Vermutlich zieht das Thema (KI-Datenanalyse) hier weniger als andere Inhalte des Creators, oder der Hook wirkt weniger polarisierend als sonst.

Belege
  • Ausreißer-Faktor 0.56x unter Account-Median 3.344,5
  • 0 Kommentare trotz CTA kommentar_keyword
  • Hook ist Story-Einstieg ohne konkrete Zahl im ersten Satz
  • Talking Head Setup ohne B-Roll oder Grafiken zur Auflockerung
Hook

„How I went from raw data to a detailed marketing plan in 1 train ride...“

Titel-/Hook-Muster

Zeitrahmen + Transformation (Rohdaten zu Ergebnis)

Für Stefan / Heartbeat

Dieses Format lässt sich als System Breakdown übernehmen, bei dem Stefan zeigt, wie er mit KI-Tools aus rohen Kundendaten in kurzer Zeit einen konkreten Marketingplan oder eine Segmentierung ableitet.

Thema

KI-gestützte Marktsegmentierung mit Claude

Sichtbar
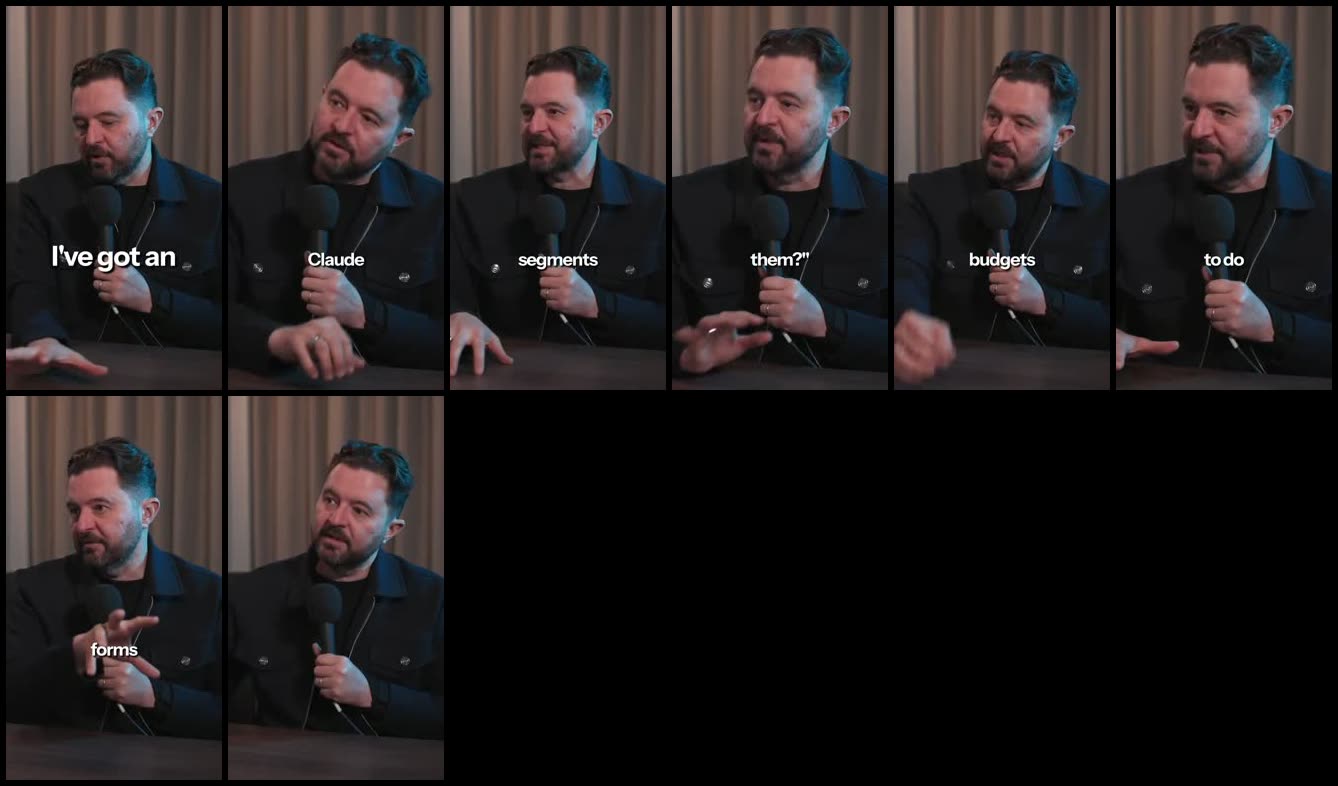
  • eine Person im Studio-Setting
  • Mikrofon sichtbar
  • dunkler Vorhang im Hintergrund
  • einwort Karaoke-Untertitel
  • kein B-Roll oder Grafiken
  • durchgehend gleiche Kameraeinstellung
kiclaudedatenanalysemarketingsegmentierungleadgen

Analyse 09.09., 09:08 · claude-sonnet-5

Kontaktbogen (8 Standbilder, zeilenweise; Zeitpunkte: 0.4s, 6.9s, 13.8s, 20.7s, 27.6s, 34.5s, 41.4s, 48.3s)
Kontaktbogen

Verlauf

MessungAlterViewsLikesKomm.Label
09.09., 09:048.8 d1.879240t0

t0 = erste Erfassung, t7 = etwa 7 Tage, t28 = etwa 28 Tage nach Veröffentlichung.

Notiz

Caption

How I went from raw data to a detailed marketing plan in 1 train ride... --- Comment BLUEPRINT for the link to my free 20-minute Masterclass - the $1M Lead Gen System Blueprint I use to generate high-quality leads.

Transkript (scribe, 204 Wörter)

anzeigen
I've got an online assessment that people take, and we had a hundred and seventy-three people take the new version of the assessment. I exported the data, I put it into Claude, and I said, "Tell me what are the key insights that you notice from this data?" It said, "Well, there's not one list here. There's three lists. There's three distinct segments within this." Mm. I said, "Great. Give me the marketing plan for each of the three segments. What are the key messages? How do I best approach them?" Boom. I said, "What I'd like you to do is to create a, a spreadsheet for me that will tell me how to allocate my budgets to attract these different audiences, given that they're likely to pay different price points." So it created a really complex spreadsheet to do that. Now, this all happened in minutes. Basically, I started on the train ride with a hundred and seventy-three forms filled in and had the data on an Excel spreadsheet. I finished the train ride with an extremely detailed marketing plan- Mm ... financial forecast, key messages, like... And then I disseminated that to my team, and we've now put that all into play.

Weitere Posts von @danielpriestley

alle