heartbeatRadar

← Instagram

Original öffnen ↗
@neilpatelNeil Patel·US·677k Follower

We asked 1,000 marketers how often they post, and we discovered a crazy trend.

Reel·58s·veröffentlicht 10.09.26 (vor 1 Monat)·erfasst 14.09.26
2,4×*Faktor (Views / Median 6.485, n=35)
15.817Views
282Likes
213Kommentare
Talking Head + B-RollFallstudie / ProofHook: zahl konkret45-90sProduktion: poliertUntertitel: styled burned inCTA: kommentar keywordKonfidenz hoch

Warum es zieht

Der Post erreichte einen Ausreißer-Faktor von 2,42x über dem Median des Accounts, liegt aber mit 15.817 Views deutlich unter dem was man bei diesem Follower-Level erwarten würde. Der Hook startet mit einer konkreten Studie (1.000 Marketer) und einer Zahlenreihe, was Aufmerksamkeit erzeugen kann. Die Machart wechselt zwischen Talking Head und eingeblendeten Balkendiagramm-Grafiken als B-Roll, was Komplexität visuell stützt. Die Kommentare (213) sind im Verhältnis zu Views recht hoch, was zum Comment-CTA passen könnte, aber das ist nur eine Beobachtung ohne kausalen Beleg.

Belege
  • Ausreißer-Faktor 2,42x über Account-Median
  • Hook beginnt mit konkreter Zahl (1.000 Marketer befragt)
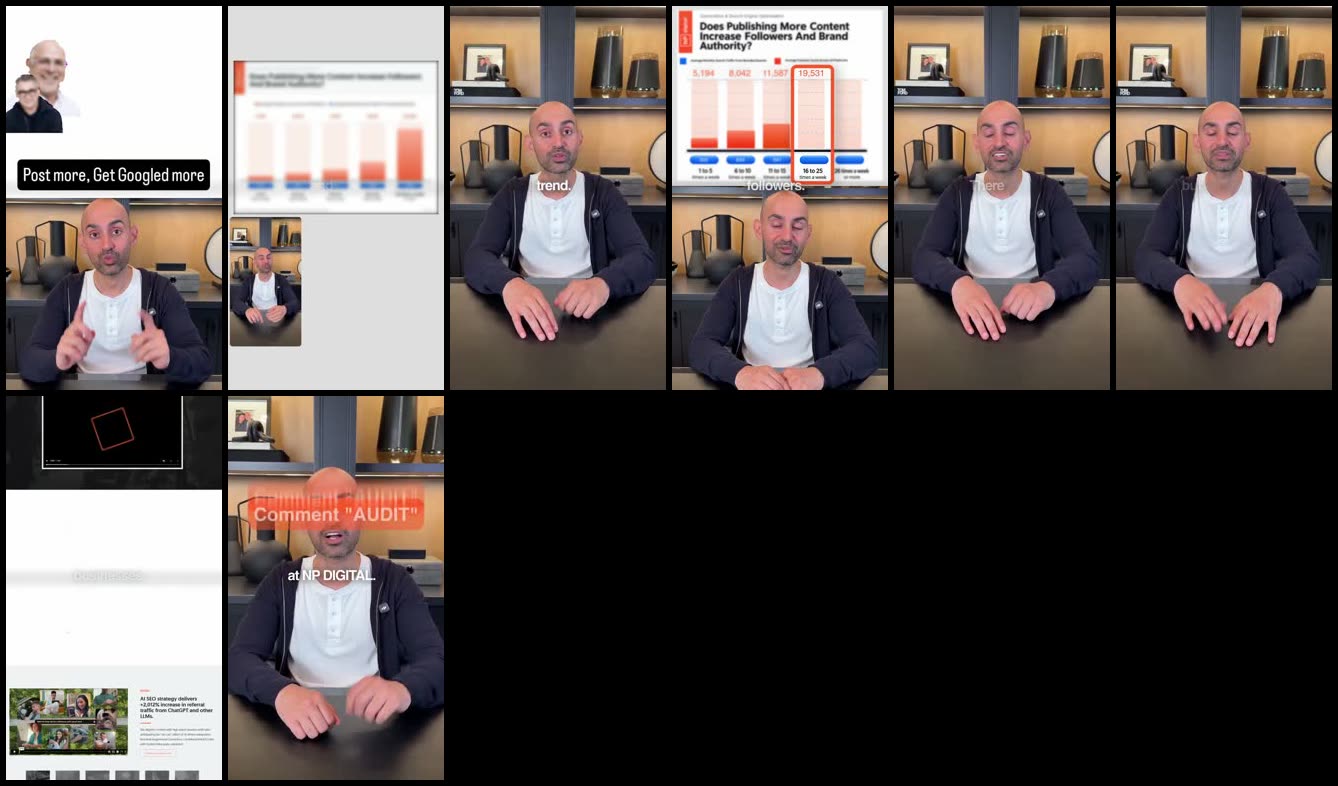
  • Balkendiagramm als B-Roll-Grafik eingeblendet (Standbild 4)
  • Styled Burned-in Untertitel durchgehend sichtbar
  • Kommentar-Keyword-CTA (AUDIT) am Ende
  • 213 Kommentare bei 15.817 Views, vergleichsweise hohe Interaktionsrate
Hook

„We asked 1,000 marketers how often they post, and we discovered a crazy trend.“

Titel-/Hook-Muster

Studie mit N + überraschender Trend + Zahlenreihe

Für Stefan / Heartbeat

Ein System Breakdown mit eigener Datenerhebung (z. B. 'Wir haben X Kunden analysiert') liefert glaubwürdigen Proof und lässt sich mit Talking Head plus eingeblendeten Balkendiagrammen als B-Roll umsetzen, kombiniert mit einem Kommentar-Keyword-CTA für die DM-Automation.

Thema

Posting-Frequenz und Follower- und Suchvolumen-Wachstum

Sichtbar
  • Talking Head Setup im Büro mit Regal im Hintergrund
  • Balkendiagramm-Grafik mit fünf Frequenzstufen eingeblendet
  • Styled Burned-in Untertitel weiß auf transparentem Hintergrund
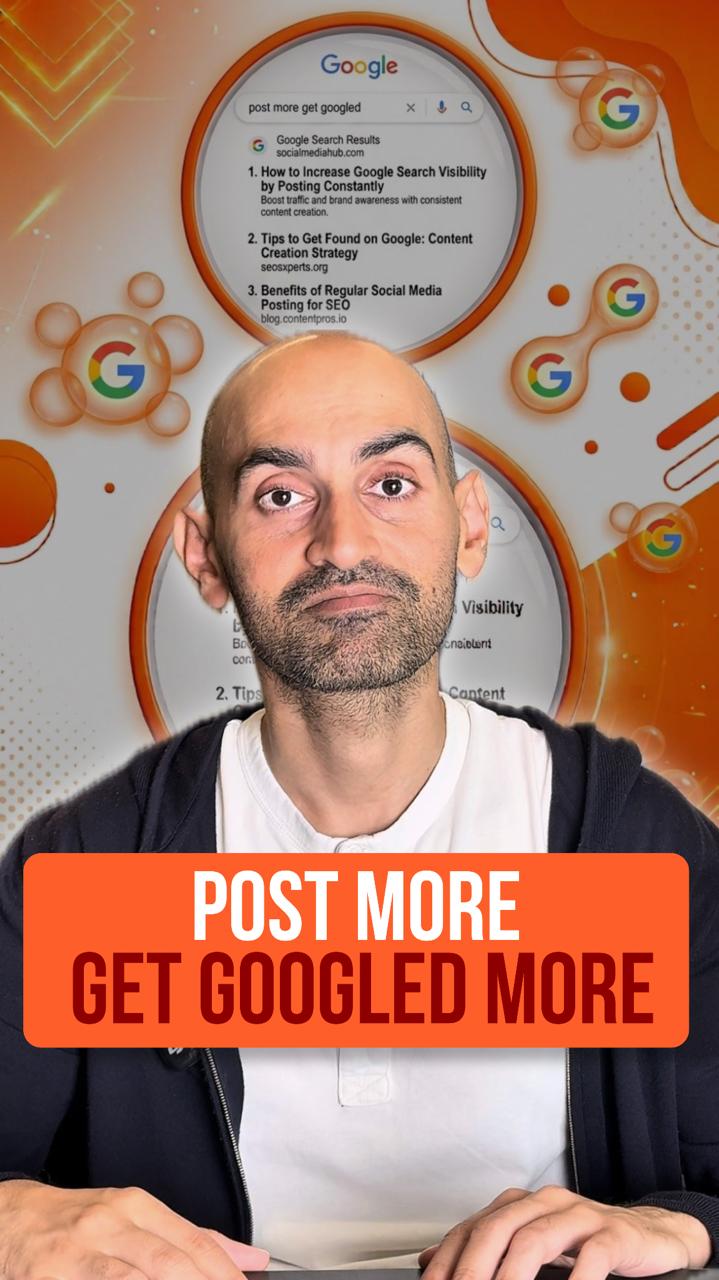
  • Text-Overlay 'Post more, Get Googled more' zu Beginn
  • Rotes Rahmen-Overlay zur Hervorhebung einer Datenspalte
  • Comment AUDIT Call-to-Action Textoverlay am Ende
  • Screenshot einer Case-Study-Webseite gegen Ende
studieposting-frequenzfallstudiebalkendiagrammseobrand-search

Analyse 14.09., 07:19 · claude-sonnet-5

Kontaktbogen (8 Standbilder, zeilenweise; Zeitpunkte: 0.4s, 2.5s, 4.3s, 28.9s, 40.9s, 42.9s, 50.2s, 52.9s)
Kontaktbogen

Verlauf

MessungAlterViewsLikesKomm.Label
14.09., 06:433.4 d15.817282213t0

t0 = erste Erfassung, t7 = etwa 7 Tage, t28 = etwa 28 Tage nach Veröffentlichung.

Notiz

Caption

We asked 1,000 marketers how often they post and discovered a crazy trend. The ones posting 1 to 5 times a week sat at about 5,000 followers. And got about 302 people a month typing their brand name into Google. Those who posted 6 to 10 times a week had 8,000 followers. And received 634 searches. At 11 to 15: over 11,000 followers. And 591 visitors from brand queries. But at a posting frequency of 16 to 25, they had nearly 20,000 followers. And 2,833 people searching for them. And when you went to 26 or more, you got 53,000 followers. And 6,037 people a month Googling the brand name. There are several other factors that can contribute to this but the trend is clear. The followers went up 10 times. And the searches went up 20. Twice as fast. That level of visibility transforms businesses. And it's exactly what we track at NP Digital. Comment "AUDIT" and I'll send you a free content and visibility audit so you know exactly where you stand.

Transkript (scribe, 186 Wörter)

anzeigen
We asked 1,000 markers how often they post, and we discovered a crazy trend. The ones posting one to five times a week sat around 5,000 followers and got roughly 302 people a month typing their brand name into Google. Those who posted six to ten times a week had roughly 8,000 followers and received 634 searches. At 11 to 15 posts a week, roughly 11,000 followers and 591 visitors from brand queries. But at a posting frequency of 16 to 25 times a week, they had nearly 20,000 followers and 2,833 people searching for them. And when we went to 26 or more posts a week, you got 53,000 followers and 6,037 people googling the brand name each and every single month. There are several factors that can contribute to this, but the trend is clear. The followers went up 10 times and the searches went up 20, twice as fast. That level of visibility transforms businesses, and it's exactly what we track at NP Digital. Comment "audit" and I'll send you a free content and visibility audit so you know exactly where you stand.

Weitere Posts von @neilpatel

alle